Download the full 2018 annual report here
An alarming finding in Resilinc’s 2018 EventWatch data was that only 12% of the 12,558 manufacturing sites that were potentially impacted by supply chain events had an alternate site available. One Alabama USA manufacturing site to which Resilinc mapped 7,370 parts—the highest number of parts mapped to any manufacturing site—had no alternative site available and an estimated Maximum Time to Recovery of 26 weeks.
As shown below, the relevant percentages varied dramatically between industry verticals. In some cases, such as the Life Science industry, the lack of alternate sites has a clear explanation. For Life Sciences, it is often due to the lengthy and complicated process of qualifying supplier sites. Thus sole-source supplier relationships are common in that industry. In other industries, there may be significant opportunities to enhance supply chain resiliency by working with manufacturing suppliers to identify alternate sites to which sourcing could be shifted in the event of disruptions to the primary site.
Across All Industries

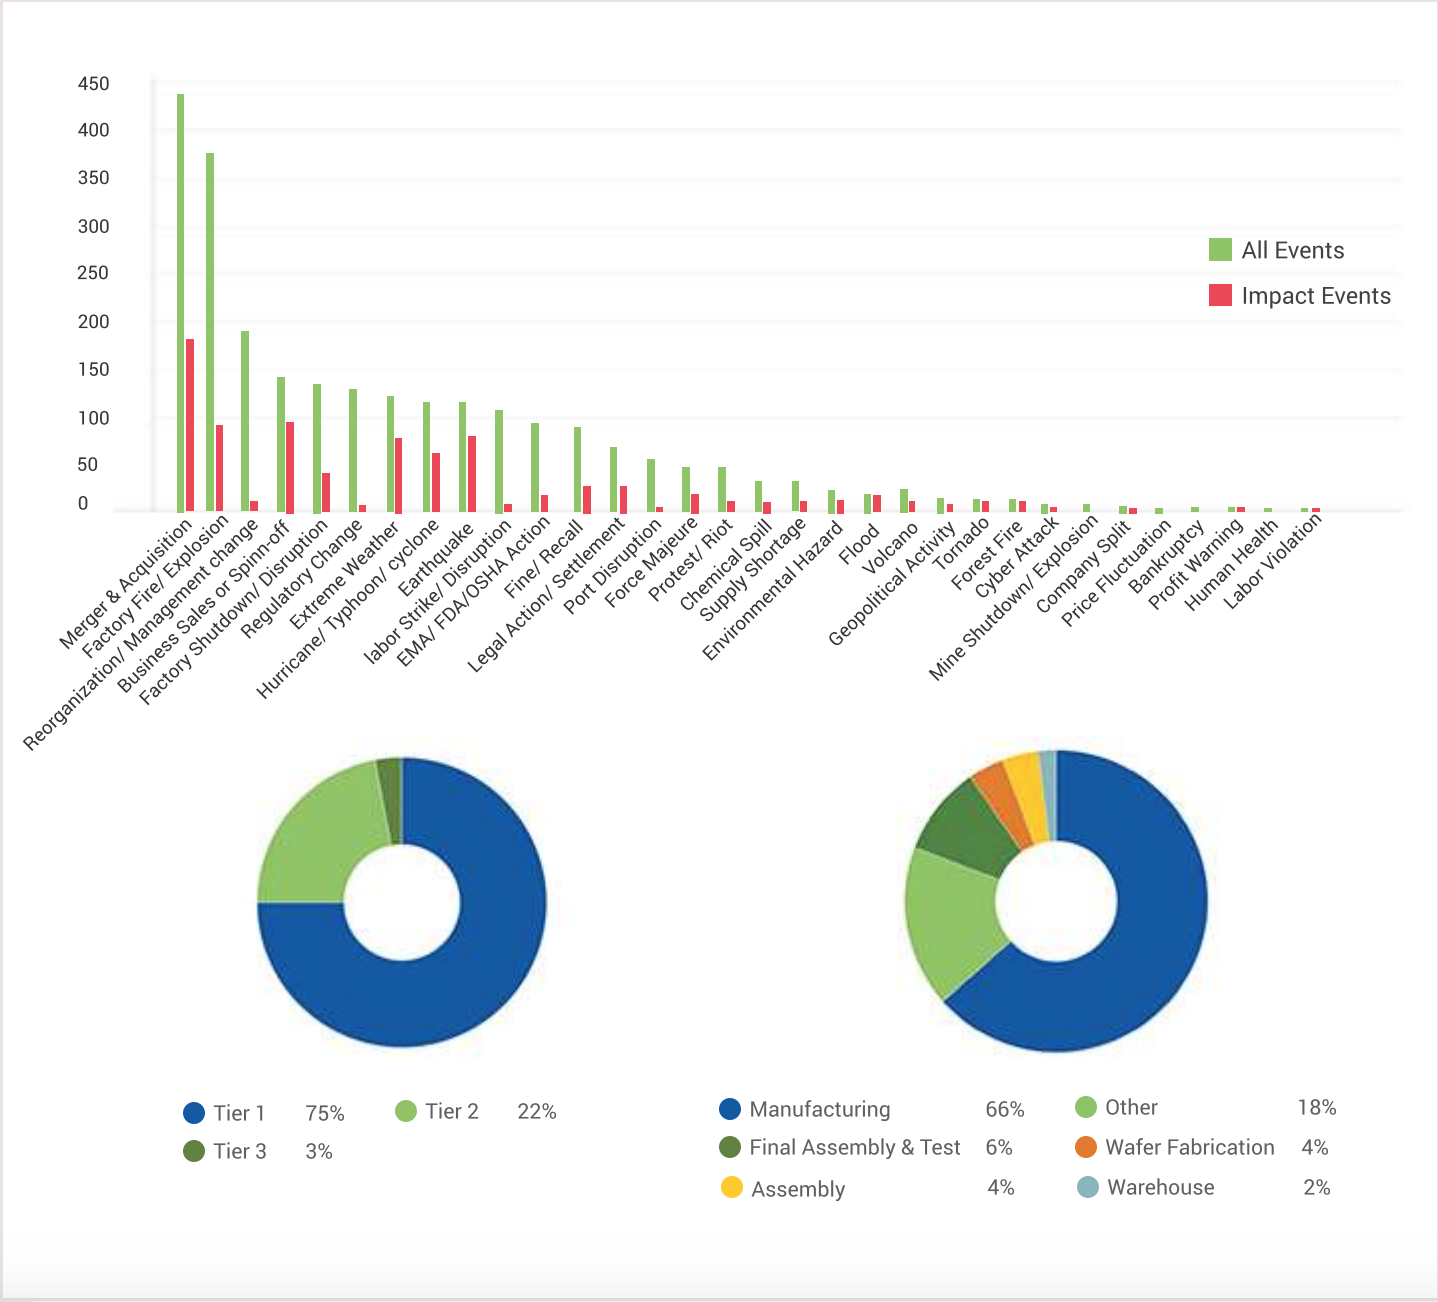
The chart above details all events and impact events reported for all industries in 2018.
Almost 35% of 2,629 events issued required impact assessment.
Other relevant data include:
• 21,152 suppliers required an impact assessment pertaining to 58,191 n-tier sites and 552,950 parts.
• Of the 58,191 sites, 75% tier 1, 22% tier 2 and 3% tier 3 sites were identified as potentially affected.
• Maximum Time to recovery (TTR) recorded for potentially affected sites was 52 weeks, and average TTR 28.35 weeks.
• 66% of the sites with activities mapped, perform manufacturing.
• An alarming observation in 2018 site activity data indicates that only 12% of the 12,558 manufacturing sites have an alternate site available.
• Almost 50% of the total number of parts are mapped to sites that perform manufacturing. Highest number of parts mapped to one site are 7,370, an Alabama, USA based site with no alternate site available and TTR of 26 weeks.
• Overall, a total of 47 unique site activities were potentially affected in 907 impact events in 2018.
• The top 5 are: Manufacturing, Final Assembly & Test, Wafer Fabrication, Assembly, and Warehouse.
• Other site activities which represent 18% of all include: Technical Services, Fabrication, Distribution/Hub, Distribution, Testing, Recycling, Returns & Repairs, Business Services, Molding, RM Processing, Application Hosting, IT Production Support, Transportation, Clean Room Assembly, Connectivity, Other Service, Print Services, Logistics, Plating & Finishing, Marketing Communications, Reporting, R&D and Design, Information Technology Products, Services and Maintenance, Facilities Management and Operations, Software Development, NPP, Software Services, Policy Administration, Consulting, Medical Testing, Insurance Application Processing/Imaging, Glass, PCB Fabrication, Hard Disk Drive Assembly, Slider Fab, System Integration, Complimentary Workforce, Banking, and Telecommunication Services.


